One of the features which I like most and released in Oracle GoldenGate 12.2 is the Oracle GoldenGate Performance Toolkit Monitor. This is a monitoring tool with Graphical User Interface programmed in JAVA.
The Performance Toolkit Monitor provides new metrics for diagnostics and tuning which includes the below.,:
CPU
I/O
Transactions in flight
Cache memory usage and statistics
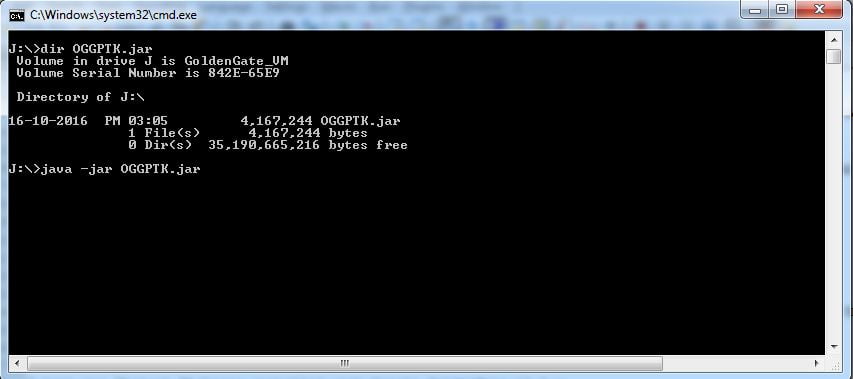
Improved capture and apply performanceA simple jar file “OGGPTK.jar” needs to be run in the server to invoke this Performance Monitor tool. This free java program jar file can be downloaded from the below link,
https://java.net/projects/oracledi/downloads/download/GoldenGate/OGGPTK.jar
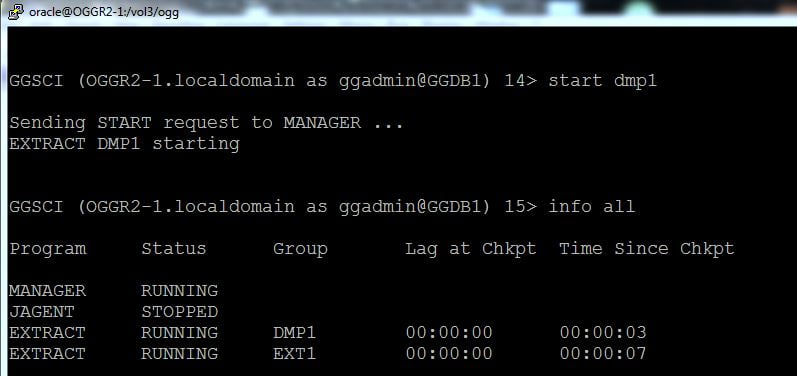
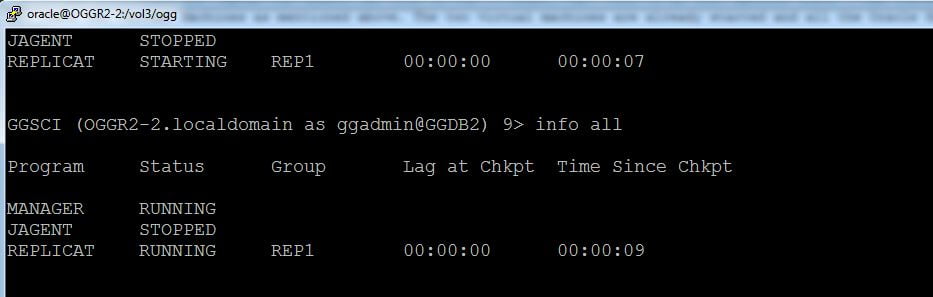
I have two Virtual Machines installed with Oracle GoldenGate 12.2.x
Virtual Machine 1 - OGGR2-1 - 192.168.0.10 - Manager, Extract and Extract Pump

Virtual Machine 2 - OGGR2-2 - 192.168.0.11 - Manager and Replicat
I had downloaded and copied the OGGPTK.jar file in the J:\OGGPTK.jar, This is my host machine where I had installed Virtual Box and have two Virtual Machines as mentioned above. The two virtual machines are already started and all the Oracle GoldenGate processes like Extract, Pump and Replicat are running currently.
Firstly, I need to start the OGGPTK.jar using the java command as below,
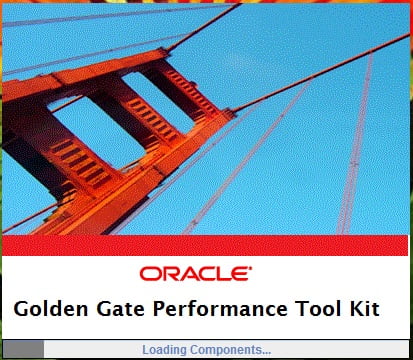
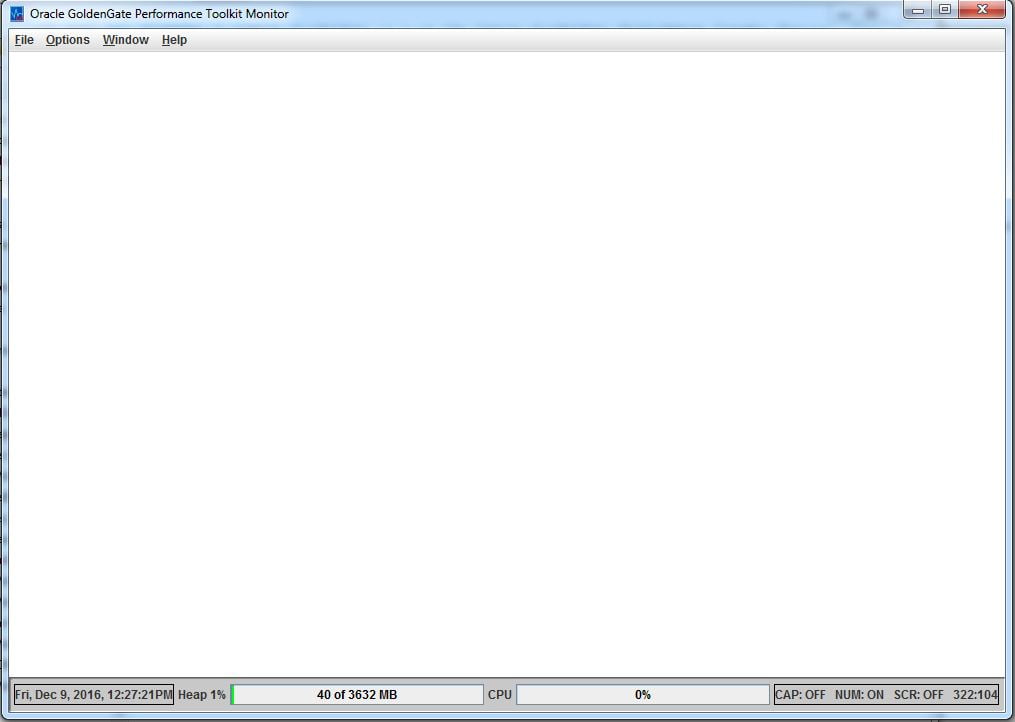
Oracle GoldenGate Performance Tool Kit window will be opened.
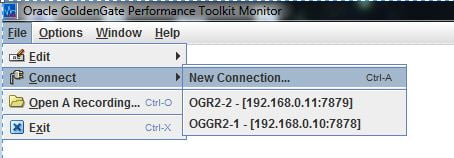
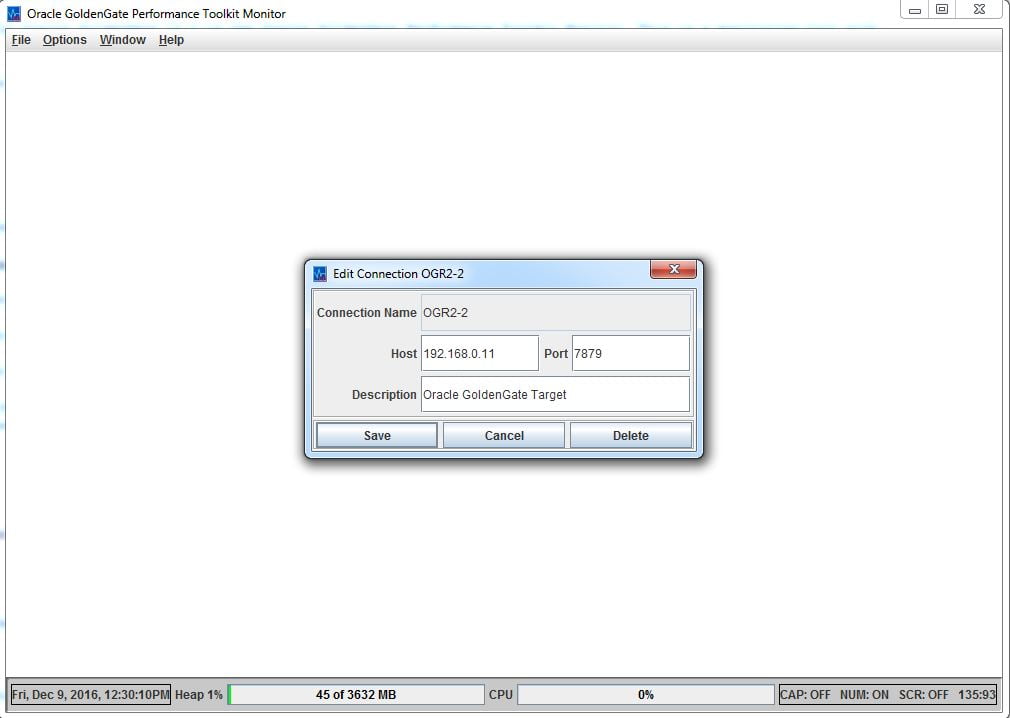
To monitor the GoldenGate instance, connection configuration must be done as below.,
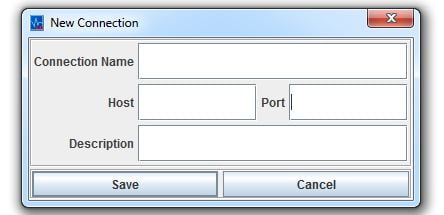
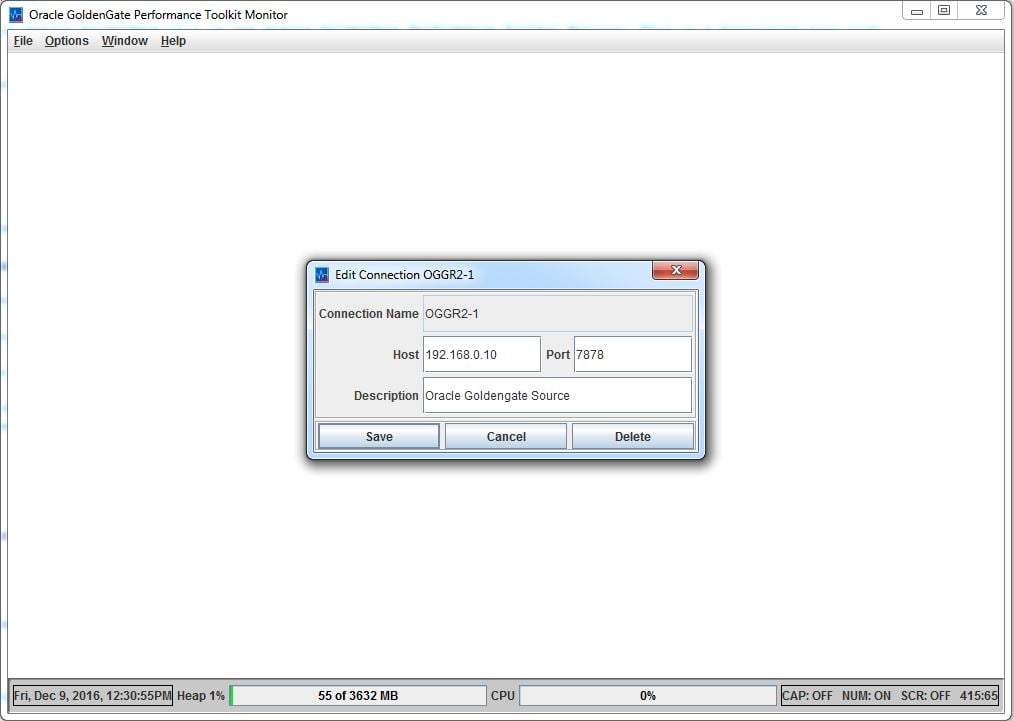
Hostname of the Oracle GoldenGate instance and the Port of the Manager process running in that respective instance must be given as below. Save the configuration.
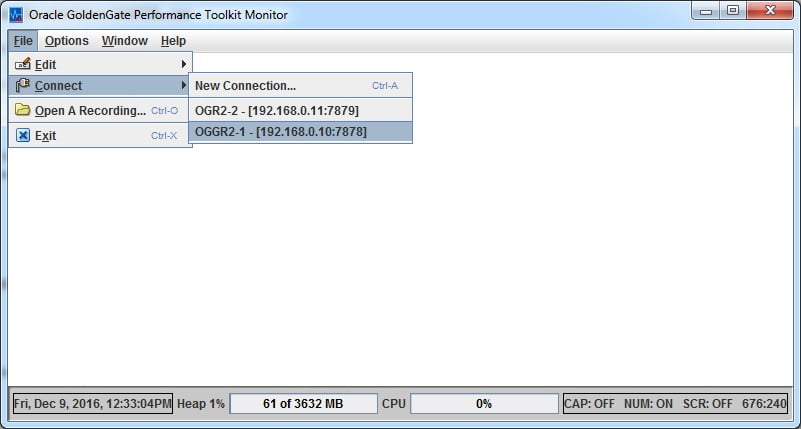
I have already configured the connection for my OGG instances. To start monitoring the Oracle GoldenGate instances go to File–>Connect–>Click the Connection Name
I have selected my Source OGG instance and the Monitoring windows for that instance will be opened as below. Click on any Process in the Left pane. For example Extract Process,
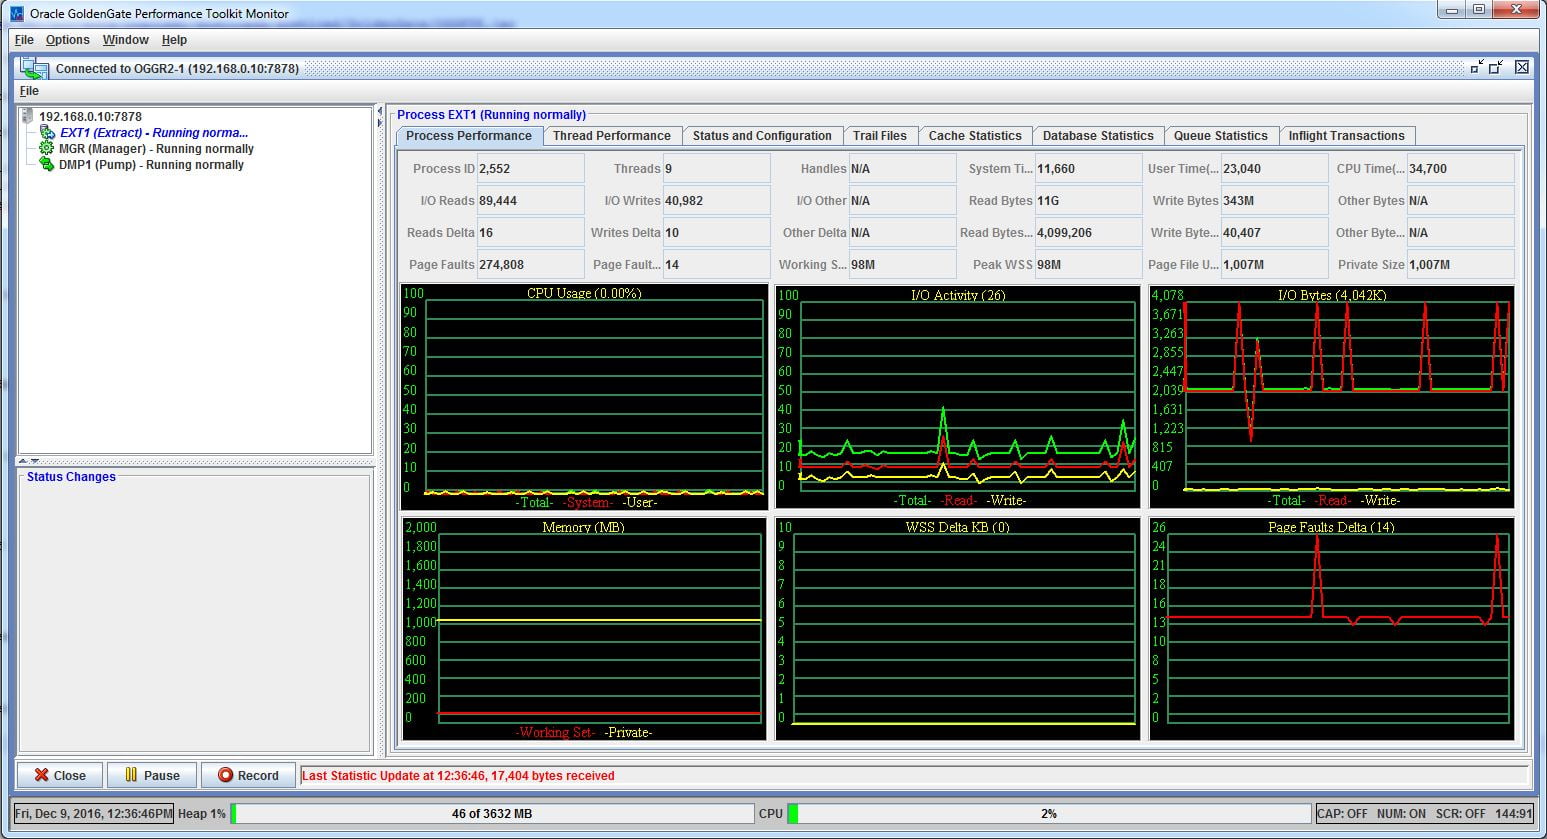
The below information can be seen in the OGGPTK window,
Process Performance
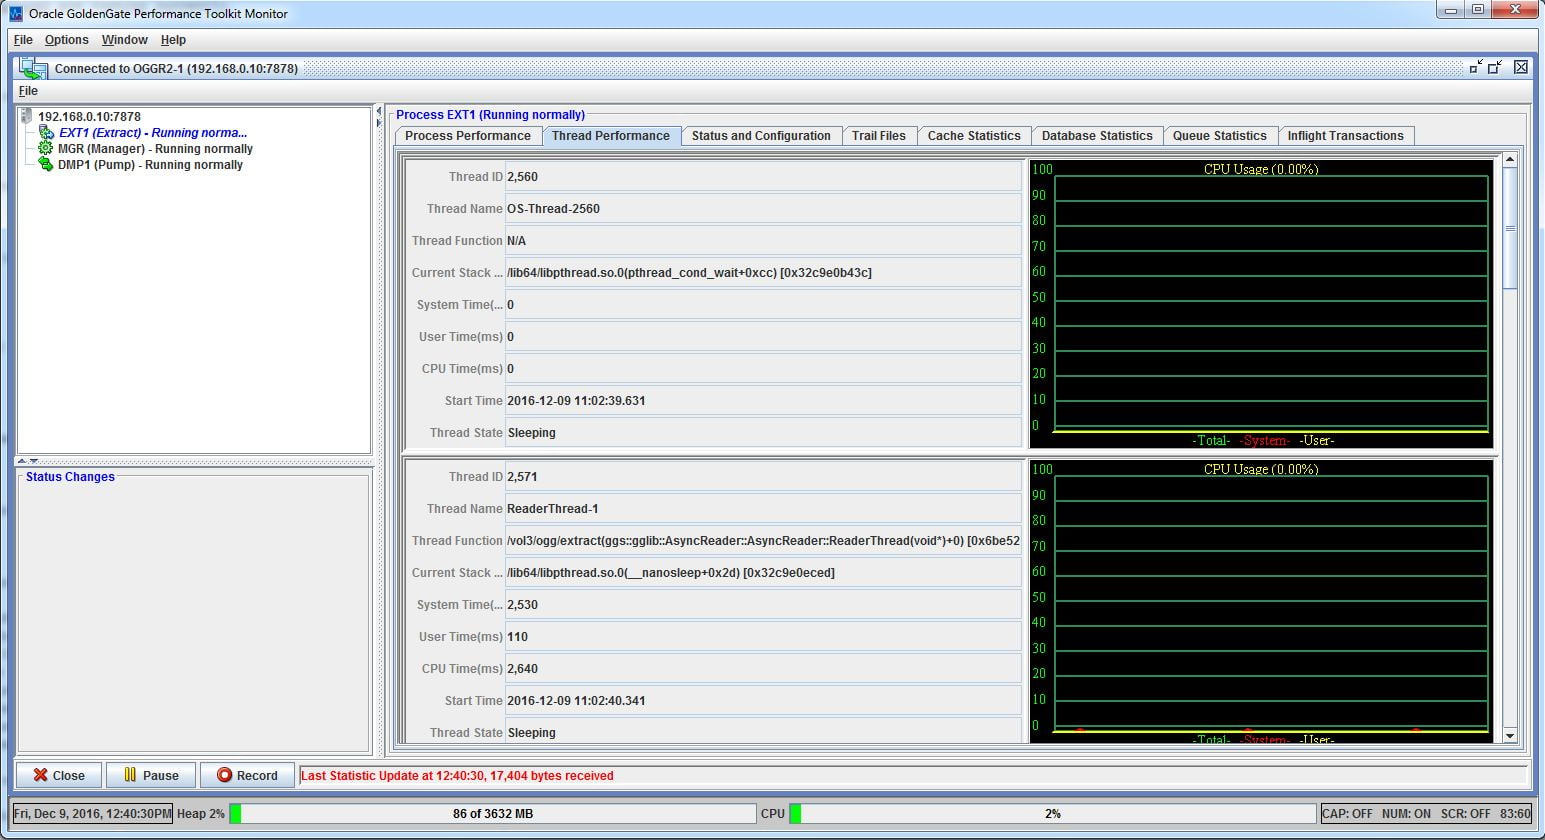
Thread Performance
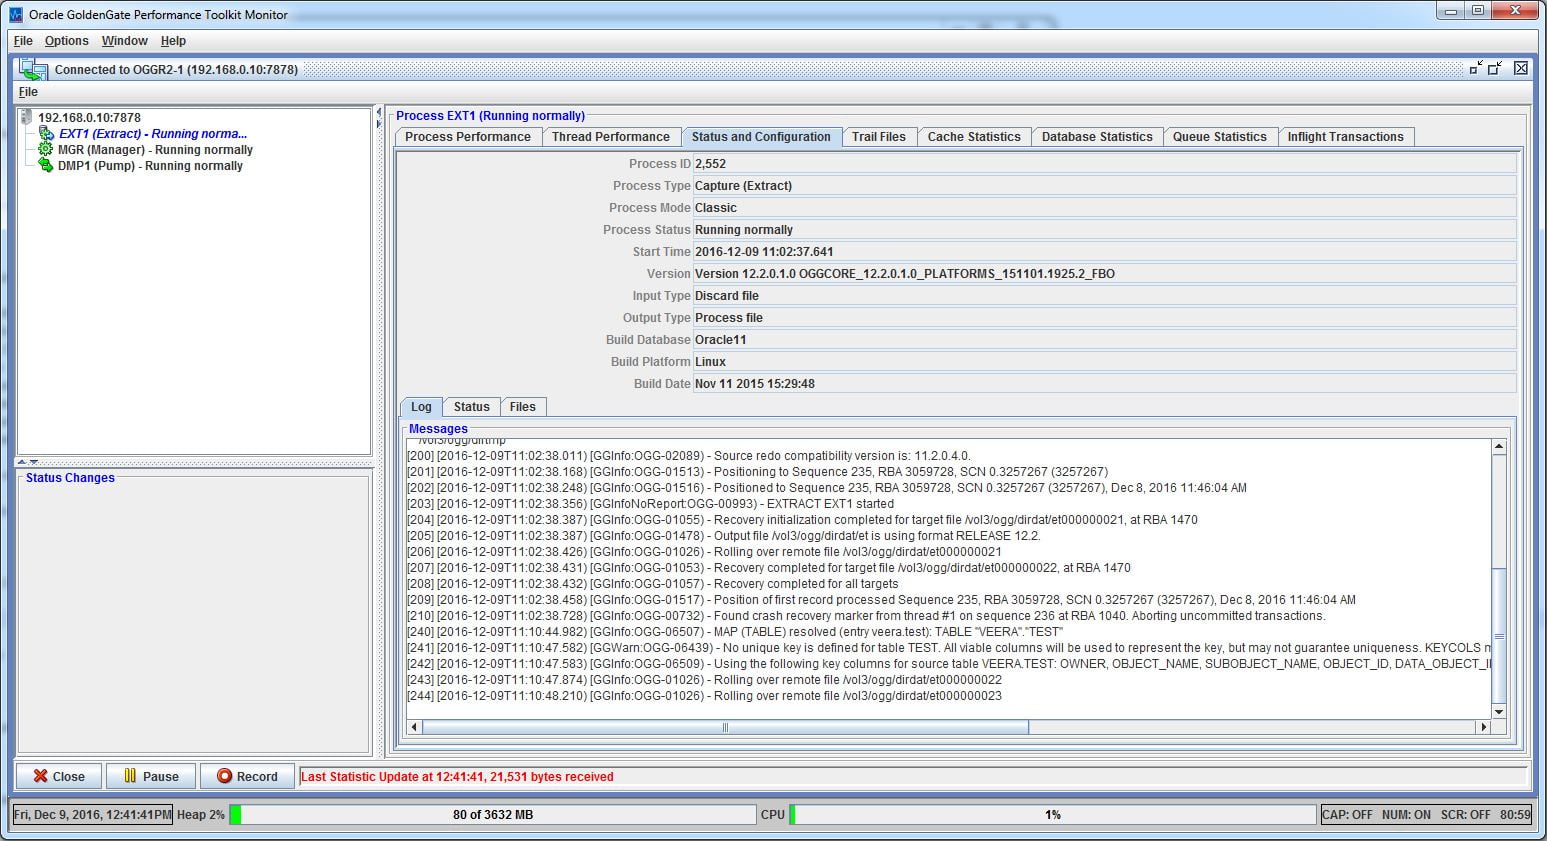
Status and Configuration
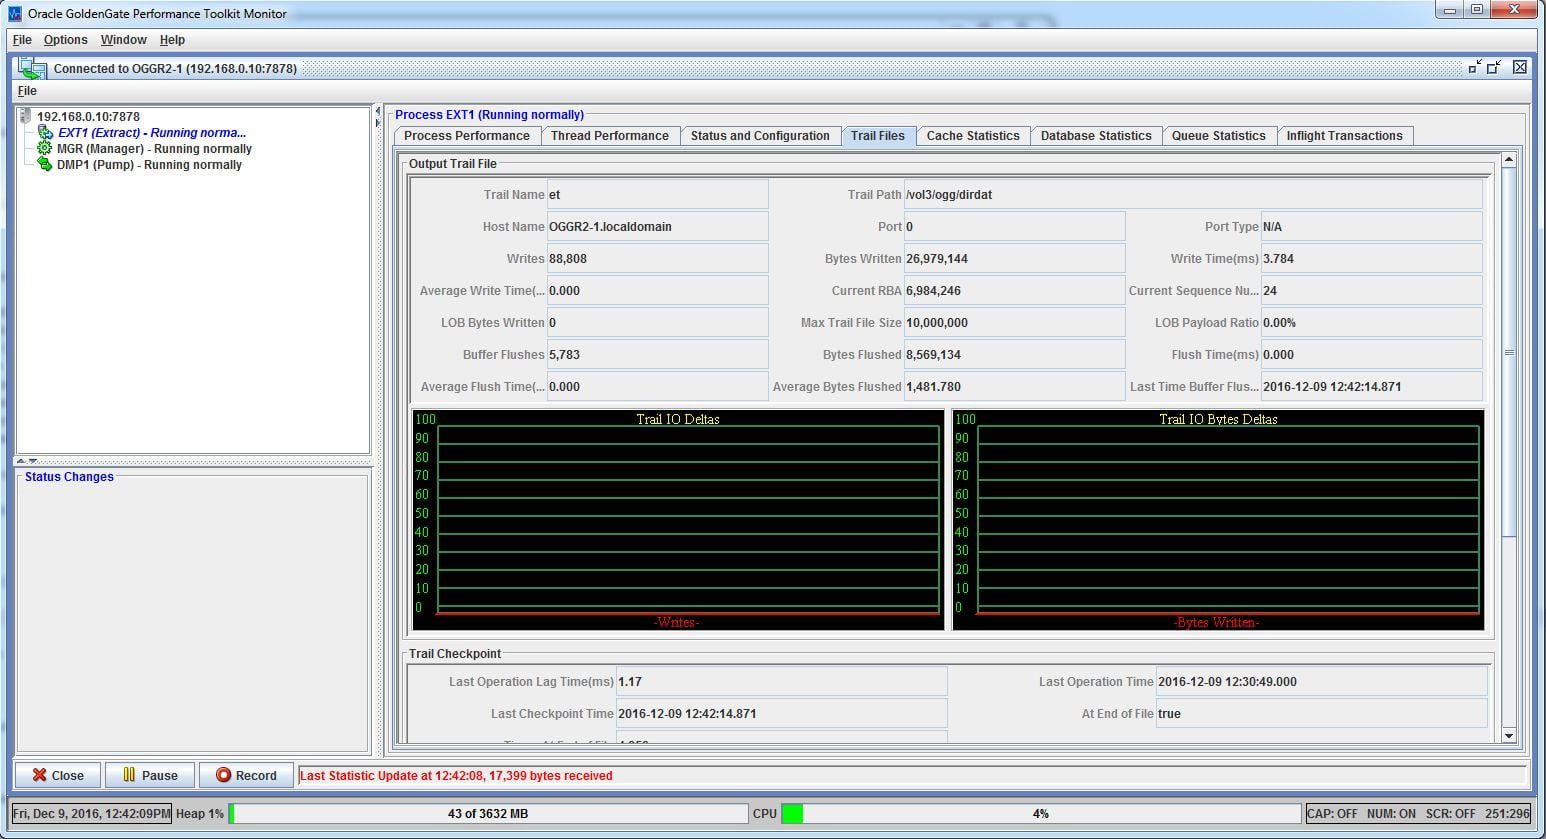
Trail Files
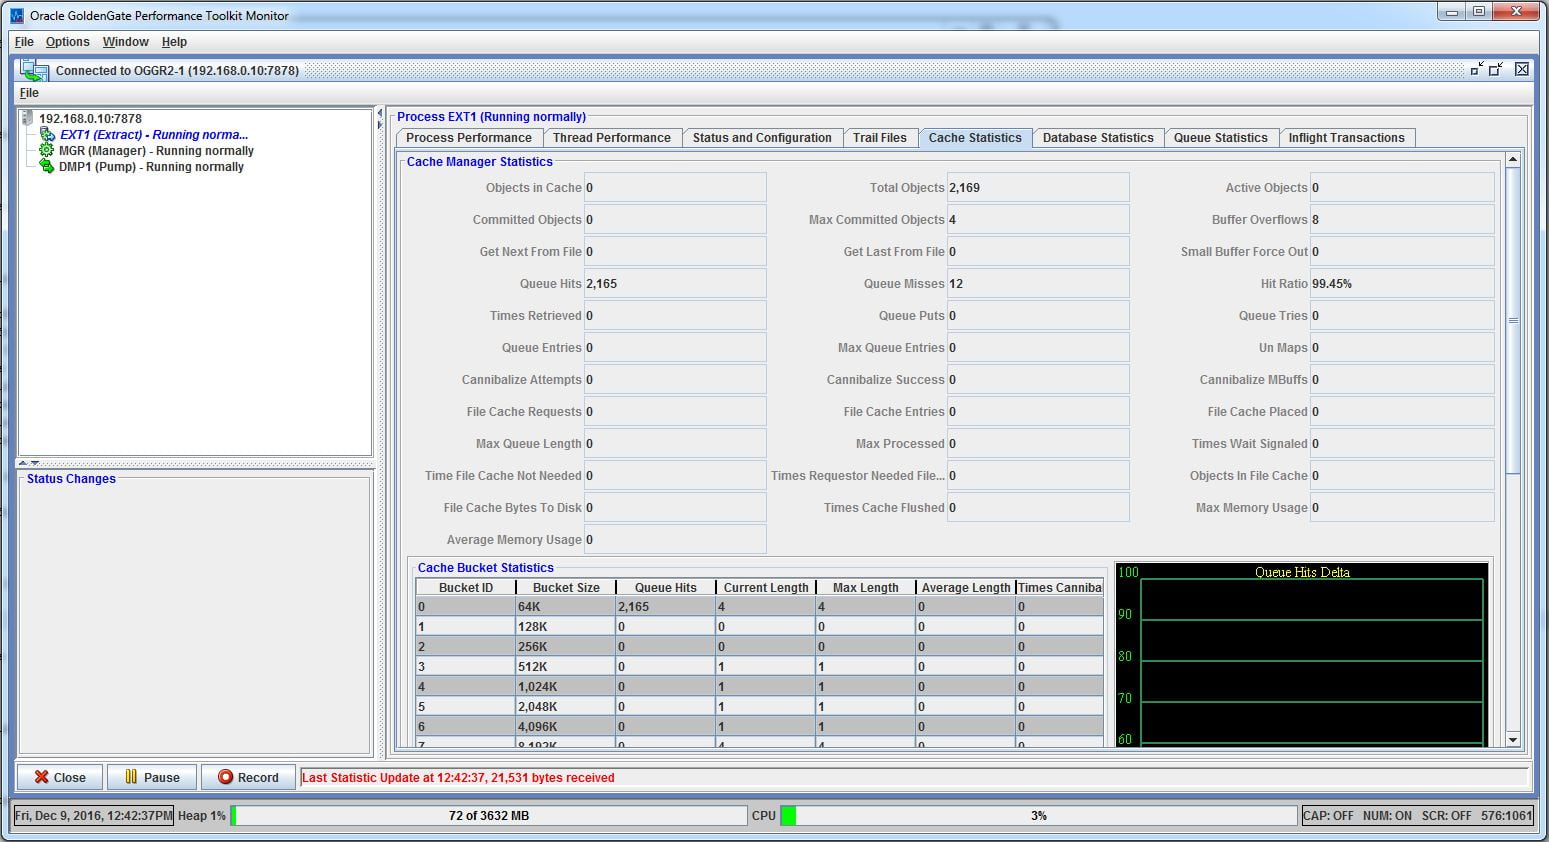
Cache Statistics
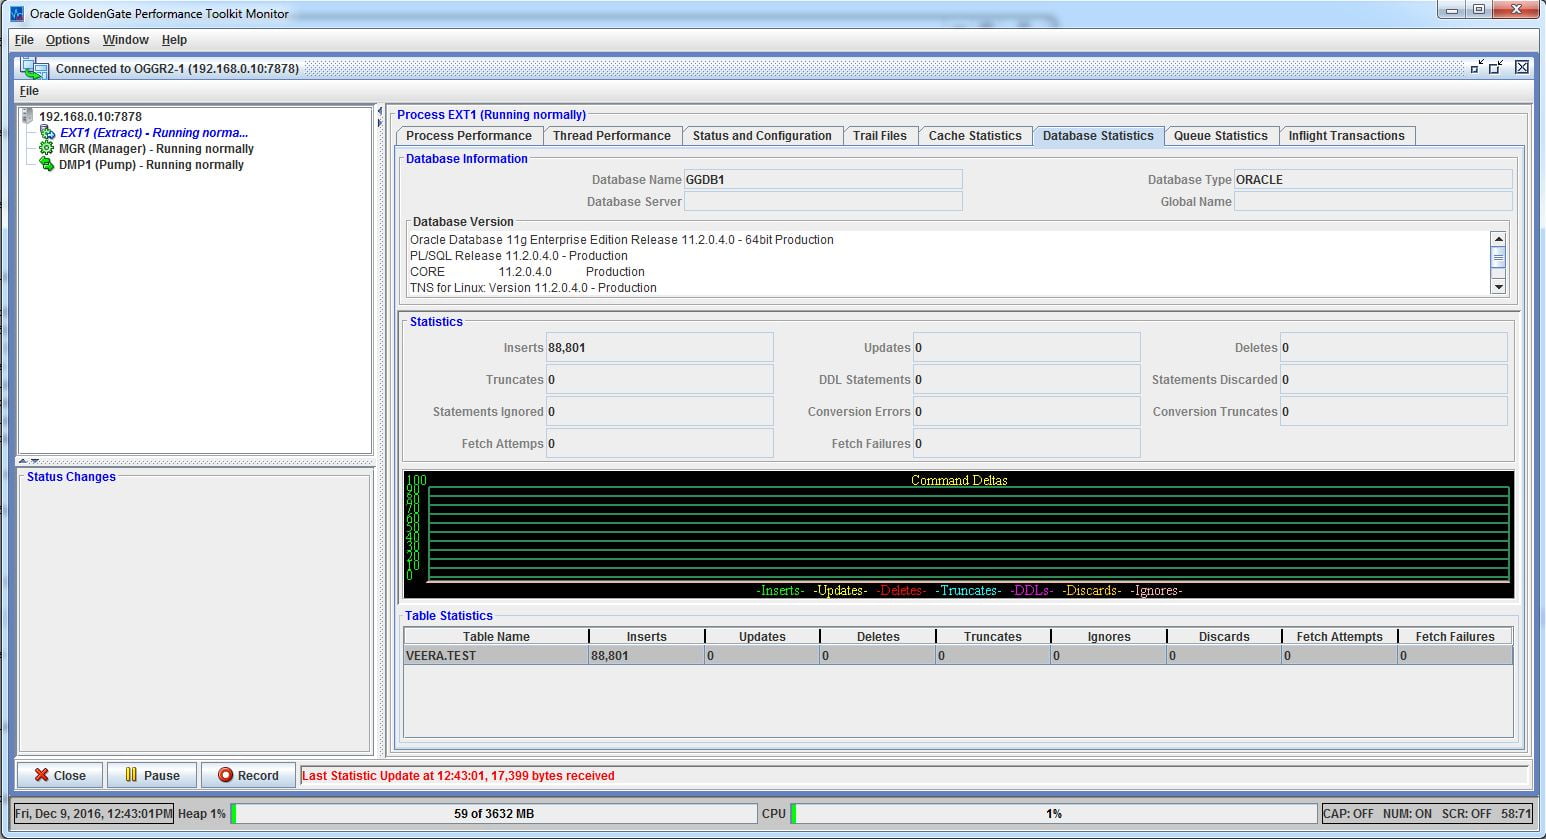
Database Statistics
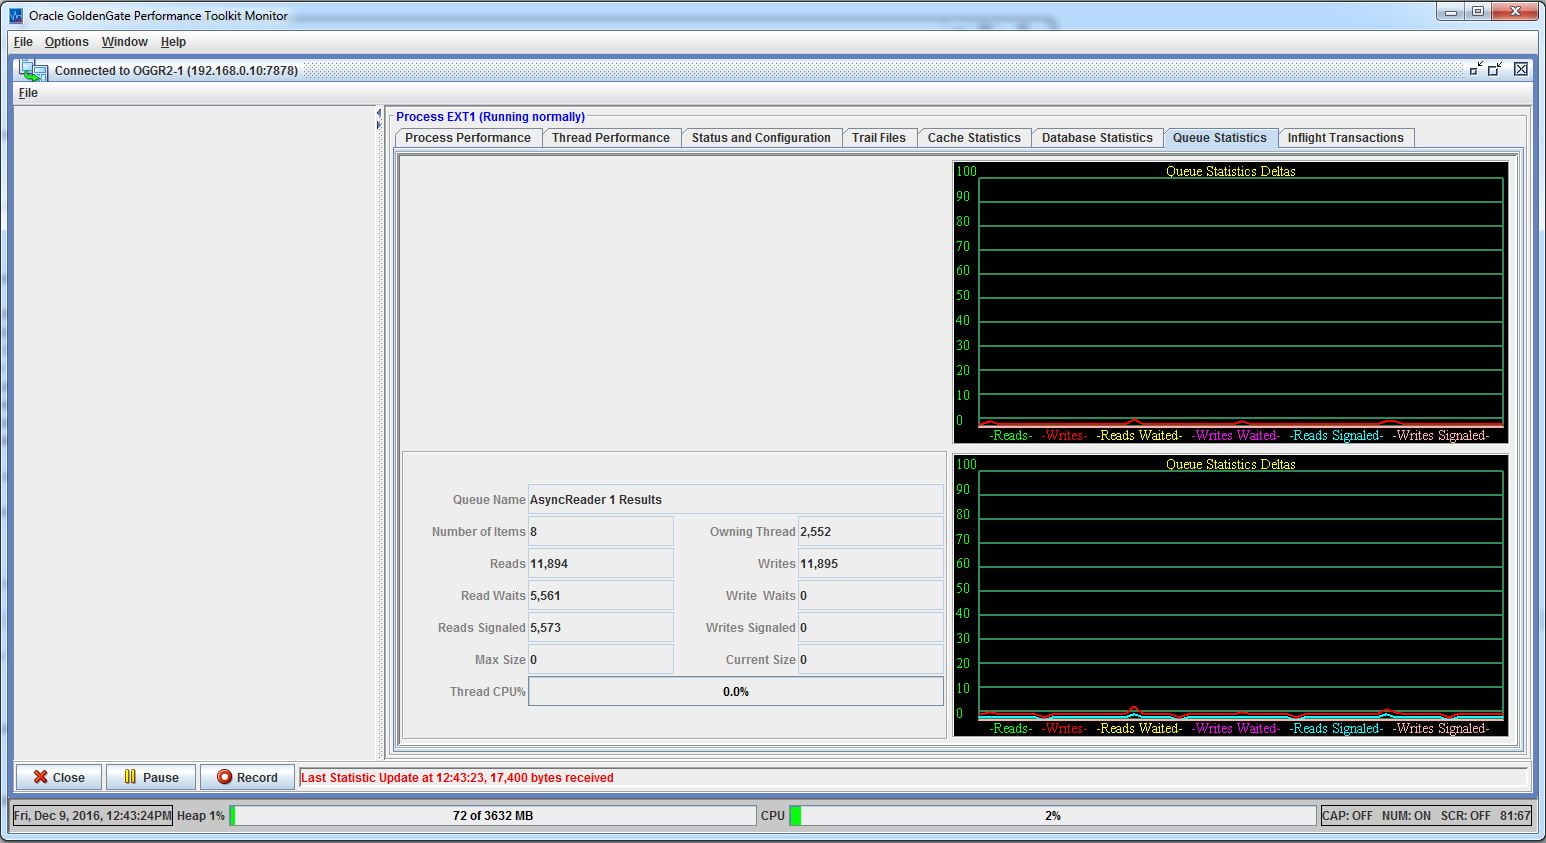
Queue Statistics
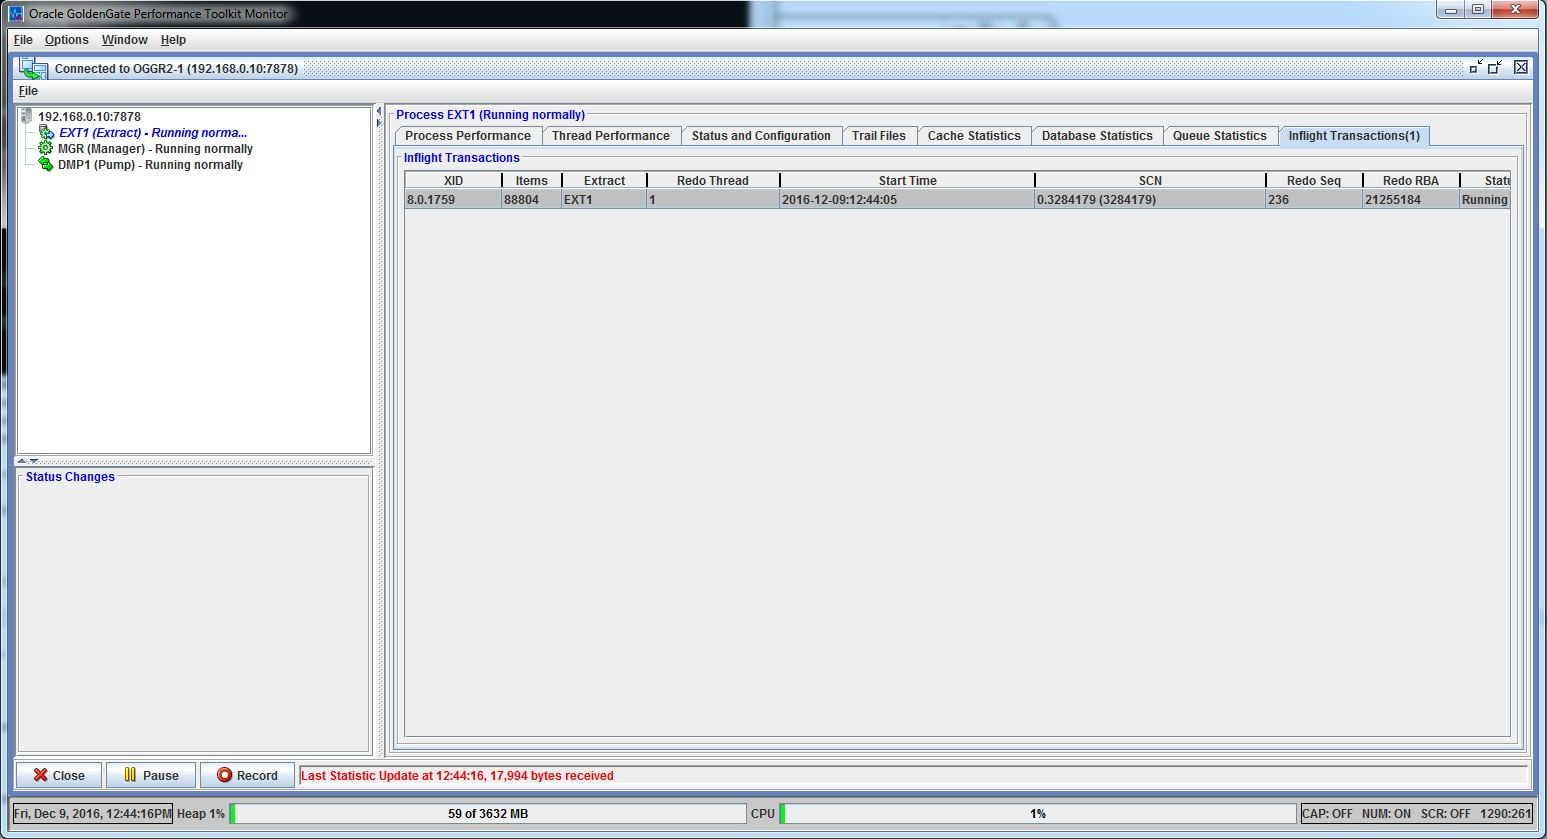
Inflight TransactionsLet us see what information each tab gives us.,
Thread Performance
Status and Configuration
Trail Files
Cache Statistics
Database Statistics
Queue Statistics
Inflight Transactions
The same kind of information we can see for the other Oracle GoldenGate processes in the instances too..
Hope this is helpful..!! Your comments and suggestions are always welcome. Thanks for your continuous support :-)


 Total Users : 1899524
Find this extremely informative and helpful.
Thanks much for the share.
Can you please upload OGGPTK.jar to different url or send it to my email: [email protected]
Thanks
You can get it from the below URL
http://www.ateam-oracle.com/oracle-goldengate-monitoring-via-restful-api/
Hi, Many thanks for the information, Very useful,
Jar file is not available in below link, seems like java.net is no more, If possible can you please provide any alternative link.
https://java.net/projects/oracledi/downloads/download/GoldenGate/OGGPTK.jar
Thanks,
Prajwal
You can get it from the below URL.,
http://www.ateam-oracle.com/oracle-goldengate-monitoring-via-restful-api/